Pistachios on the Move: Examining the Impact of Climate Change on Pistachio Suitability Zones
Abstract
Climate change is expected to have a significant impact on suitability zones for pistachio production throughout the Contiguous United States. Changes in suitability can be caused by a variety of environmental factors such as changes in temperature, precipitation, and seasonal changes; as well as changes in bioclimatic variables such as slope, aspect, and elevation. It has been identified that 98% of the pistachios grown in the United States are grown within California. This paper examines how climate change is affecting the suitability of pistachio crops in California; and provides an actionable response to the changes in suitability by identifying replacement locations that are predicted to become suitable, in or outside of California. This study utilizes Geographic Information Systems (GIS) to track and map the changes in suitability, predict future suitability zones of pistachio crops by using historic and multiple global climate models focusing on the next two decades (2041-2060) and the final decades of this century (2081-2100), while also utilizing maximum entropy (Max Ent), a supervised machine learning model that creates land-use or land-cover classifications or predictions. Max Ent has predicted suitability zone changes in accordance with each climate model. These predicted changes show a shift in the geographic range of suitable growing conditions for pistachio production. The projections obtained by the study allow us to provide farmers, policymakers, and landowners with the information necessary to make informed decisions about the cultivation in response to a changing climate.
Keywords: Climate Change, Pistachios, Maximum Entropy, Contiguous United States
1. Introduction
1.1 Impacts of Climate Change
Climate change is significantly impacting the suitability zones of various cash crops throughout the United States, with rising temperatures and changing precipitation patterns which are leading to shifts in the types of crops that can be grown in certain regions. One crop that is particularly vulnerable to these changes is pistachios, which are a major cash crop in California and are sensitive to changes in temperature and water availability.
The California Agricultural Statistics Review (2019-2020) found that pistachios were the third most valuable nut-based crop, with a production value of over 3 billion USD. California produces a large percentage of the world’s pistachios, second only to Iran which produces roughly fifty percent. Unfortunately, the future of this multibillion-dollar industry in California is uncertain due to the potential impacts of climate change on environmental conditions and water availability.
1.2. Vulnerability of Pistachio Crops
Through the examination of a variety of papers on pistachio crops, we have found that pistachios are not tolerant to extreme heat. Thus exposure to high-temperature events during the growing season can cause significant losses in yield (Derya, et al 2020). Increasing temperatures caused by a shift in climate could result in a significant decline in pistachio production. If there will be a decline in pistachio production, we would most likely require a massive agricultural transition in order to meet the high demand of pistachios.
Through our research, we also found that farmland growing pistachios, as well as other specialty crops, are projected to experience temperature increases that exceed their optimal growing ranges by 2050 (Kerr, et al 2017). Since there is a direct correlation between pistachio yields decreasing and increasing temperature, we can infer that the pistachio yields will continue to decline in the future. If adaptation measures are not implemented, the future of pistachio production in California may be in jeopardy.
2. Methods
2.1 GIS
This study utilizes Geographic Information Systems (GIS), which is often defined as a collection of computer hardware, software, geographic data, and trained personnel that are able to manipulate, update, analyze, and display all forms of geographic data. The term GIS is becoming redefined in recent years, due to the wide range of topics and information that can be analyzed. The newly developing definition of GIS is Geographic Information Science; this is because GIS has opened a new door for analyzing data and contributing to scientific studies. Individuals trained to use GIS software are able to utilize geographical data in order to solve important questions about a wide range of topics. The methods of this study will include a variety of GIS tools, including Max Ent.
2.2 Python Coding
The majority of this study has been conducted using Python scripting. Python is the coding language primarily used for ESRI products such as ArcGIS Pro and ArcMap which are both used in this study. We use python in order to streamline the workflow, keep our data organized, and run complex spatial tools. In this study, we use python scripting to input a variety of different climate models as well as land use data to perform our Max Ent predictions.
2.3 Rarified Points & Spatial Autocorrelation
The USDA provides a Cropland Data Layer (CDL) which is a raster dataset containing crop distribution throught the United States. We are analyzing raster data of California’s current distribution of land uses to better understand where pistachios are presently being grown. The raster data is converted into presence points using spatial analyst tools inside of Arc GIS Pro. These presence points are then converted to rarified points by using the “spatially rarify occurrence data” tool provided by the Species Distriubution Model (SDM) toolbox, a downloadable toolbox extension. The tool removes repeating data points in order to speed up processing times and reduce spatial autocorrelation. Spatial autocorrelation refers to the phenomenon that occurs when nearby data points invoke a stronger influence on each other compared to those at a distance. Spatial autocorrelation can influce results because crop production is typically clustered in regions of similar bioclimactic conditions.
2.4 Global Climate Models
For this study, we will be using GIS to track and map the changes in land use as well as predict future movements of pistachio crops by using Global Climate Models. These climate models provide both a historical record of the climate that has occurred throughout California’s past as well as providing predicted climate change patterns that are expected to occur over the next two decades (2041-2060) and the final decades of this century (2081-2100).
The climate models used for this study are obtained from WorldClim.org utilizing the 30 seconds resolution option (0.93 x 0.93 = 0.86 km2 at the equator). This site also offers future climate models in a variety of shared socioeconomic pathways (SSPs), which are outlined by the sixth Intergovernmental Panel on Climate Change report (IPCC AR6). We are utilizng SSP 585, which indicates the upper range of emmision scenarios that will occur if global emissions are not regulated.
Some unique elements of the global climate models used in this study include elevation, slope, and aspect. We believe these factors were important to include because greater elevations have a direct correlation to surface temperature; aspect influences a variety of factors including wind patterns, solar radiation, and atmospheric pressure; and slope determines the amount of vegetation that can be grown in the given area. These elements allow us to have a more accurate prediction on where the most suitable locations for pistachio crops will be; they can be viewed in Figure 1. The global climate models are also comprised of 19 individual raster bands. Each band contains information pertaining to a specific bioclimactic variable; a list of the variable is provided in Figure 2 and are visualized in Figure 3. These bioclimatic variables combined with the unique elements such as elevation, slope, and aspect provide a well rounded climate model for our analysis.
Figure 1. Visualization of elevation, slope, and aspect.
Figure 2. List of bioclimactic variables and unit of measurement.
Figure 3. Visualization of each bioclimactic variable.
2.5 Presence Only Prediction (Max Ent)
This study also utilizes maximum entropy (Max Ent); a supervised machine learning model used for creating land-use or land-cover classifications or predictions. We use the spatially rarefied points, global climate models, and maximum entropy learning models to perform presence-only predictions. The presence-only prediction tool allows for an input of “explanatory rasters” which is used to upload the historical bioclimatic data. The historical climatic data provide a baseline for what the climate has been in the past, allowing us to create a trained model representing the current suitibailty zones for crop production. There is also an input for “explanatory rasters matching” which is used to upload one of the eight global climate projection models which will provide insight into California’s future climate. To reduce the impact of spatial autocorrelation further, the presence only prediction tool provides a spatial thinning option. We set our spatial thinning distance for 5000 meters to allow for some of the overlapping presence points to be removed. To obtain an average of the projections of the different climate models, we utilize the fuzzy overlay tool. We input all the climate model projections for 2041 in order to get the average for that time period. We then input all the climate model projections for 2081 to obtain averages for the end of the century. The fuzzy overlay provides an output that contains the most likely areas that will be sustainable for future crops.
3. Results
We have been able to identify what regions are expected to experience expansion and contraction of pistachio suitability zones throughout the state of California. The results show the most contraction throughout Southern California and the central valley by 2061. By 2100 the central valley is expected to continue to contract but there are some small areas in Southern California that are actually expected to see some expansion. It seems that the areas in Southern California that will become unsuitable by 2061 will become suitable again by 2100; the amount of area is significantly less but the return of pistachios to this region is promising. Another region that is expected to experience some expansion as well is Northern California. The expansion isn’t extreme but, we see about six new locations that will become marginally suitable for pistachios. We can also see a significant decrease in pistachio crops being grown throughout the Sierra Nevada region; the vast majority of pistachios will have left the region by the end of the century. The most significant contraction is experienced throughout the central valley where the majority of suitable farmland will be greatly reduced.
Figure 4. Displays the current distribution of pistachio crops in California. This map accurately depicts the current distribution of pistachio suitability zones in California. We can use this map as a baseline reference for future expansion and contraction.
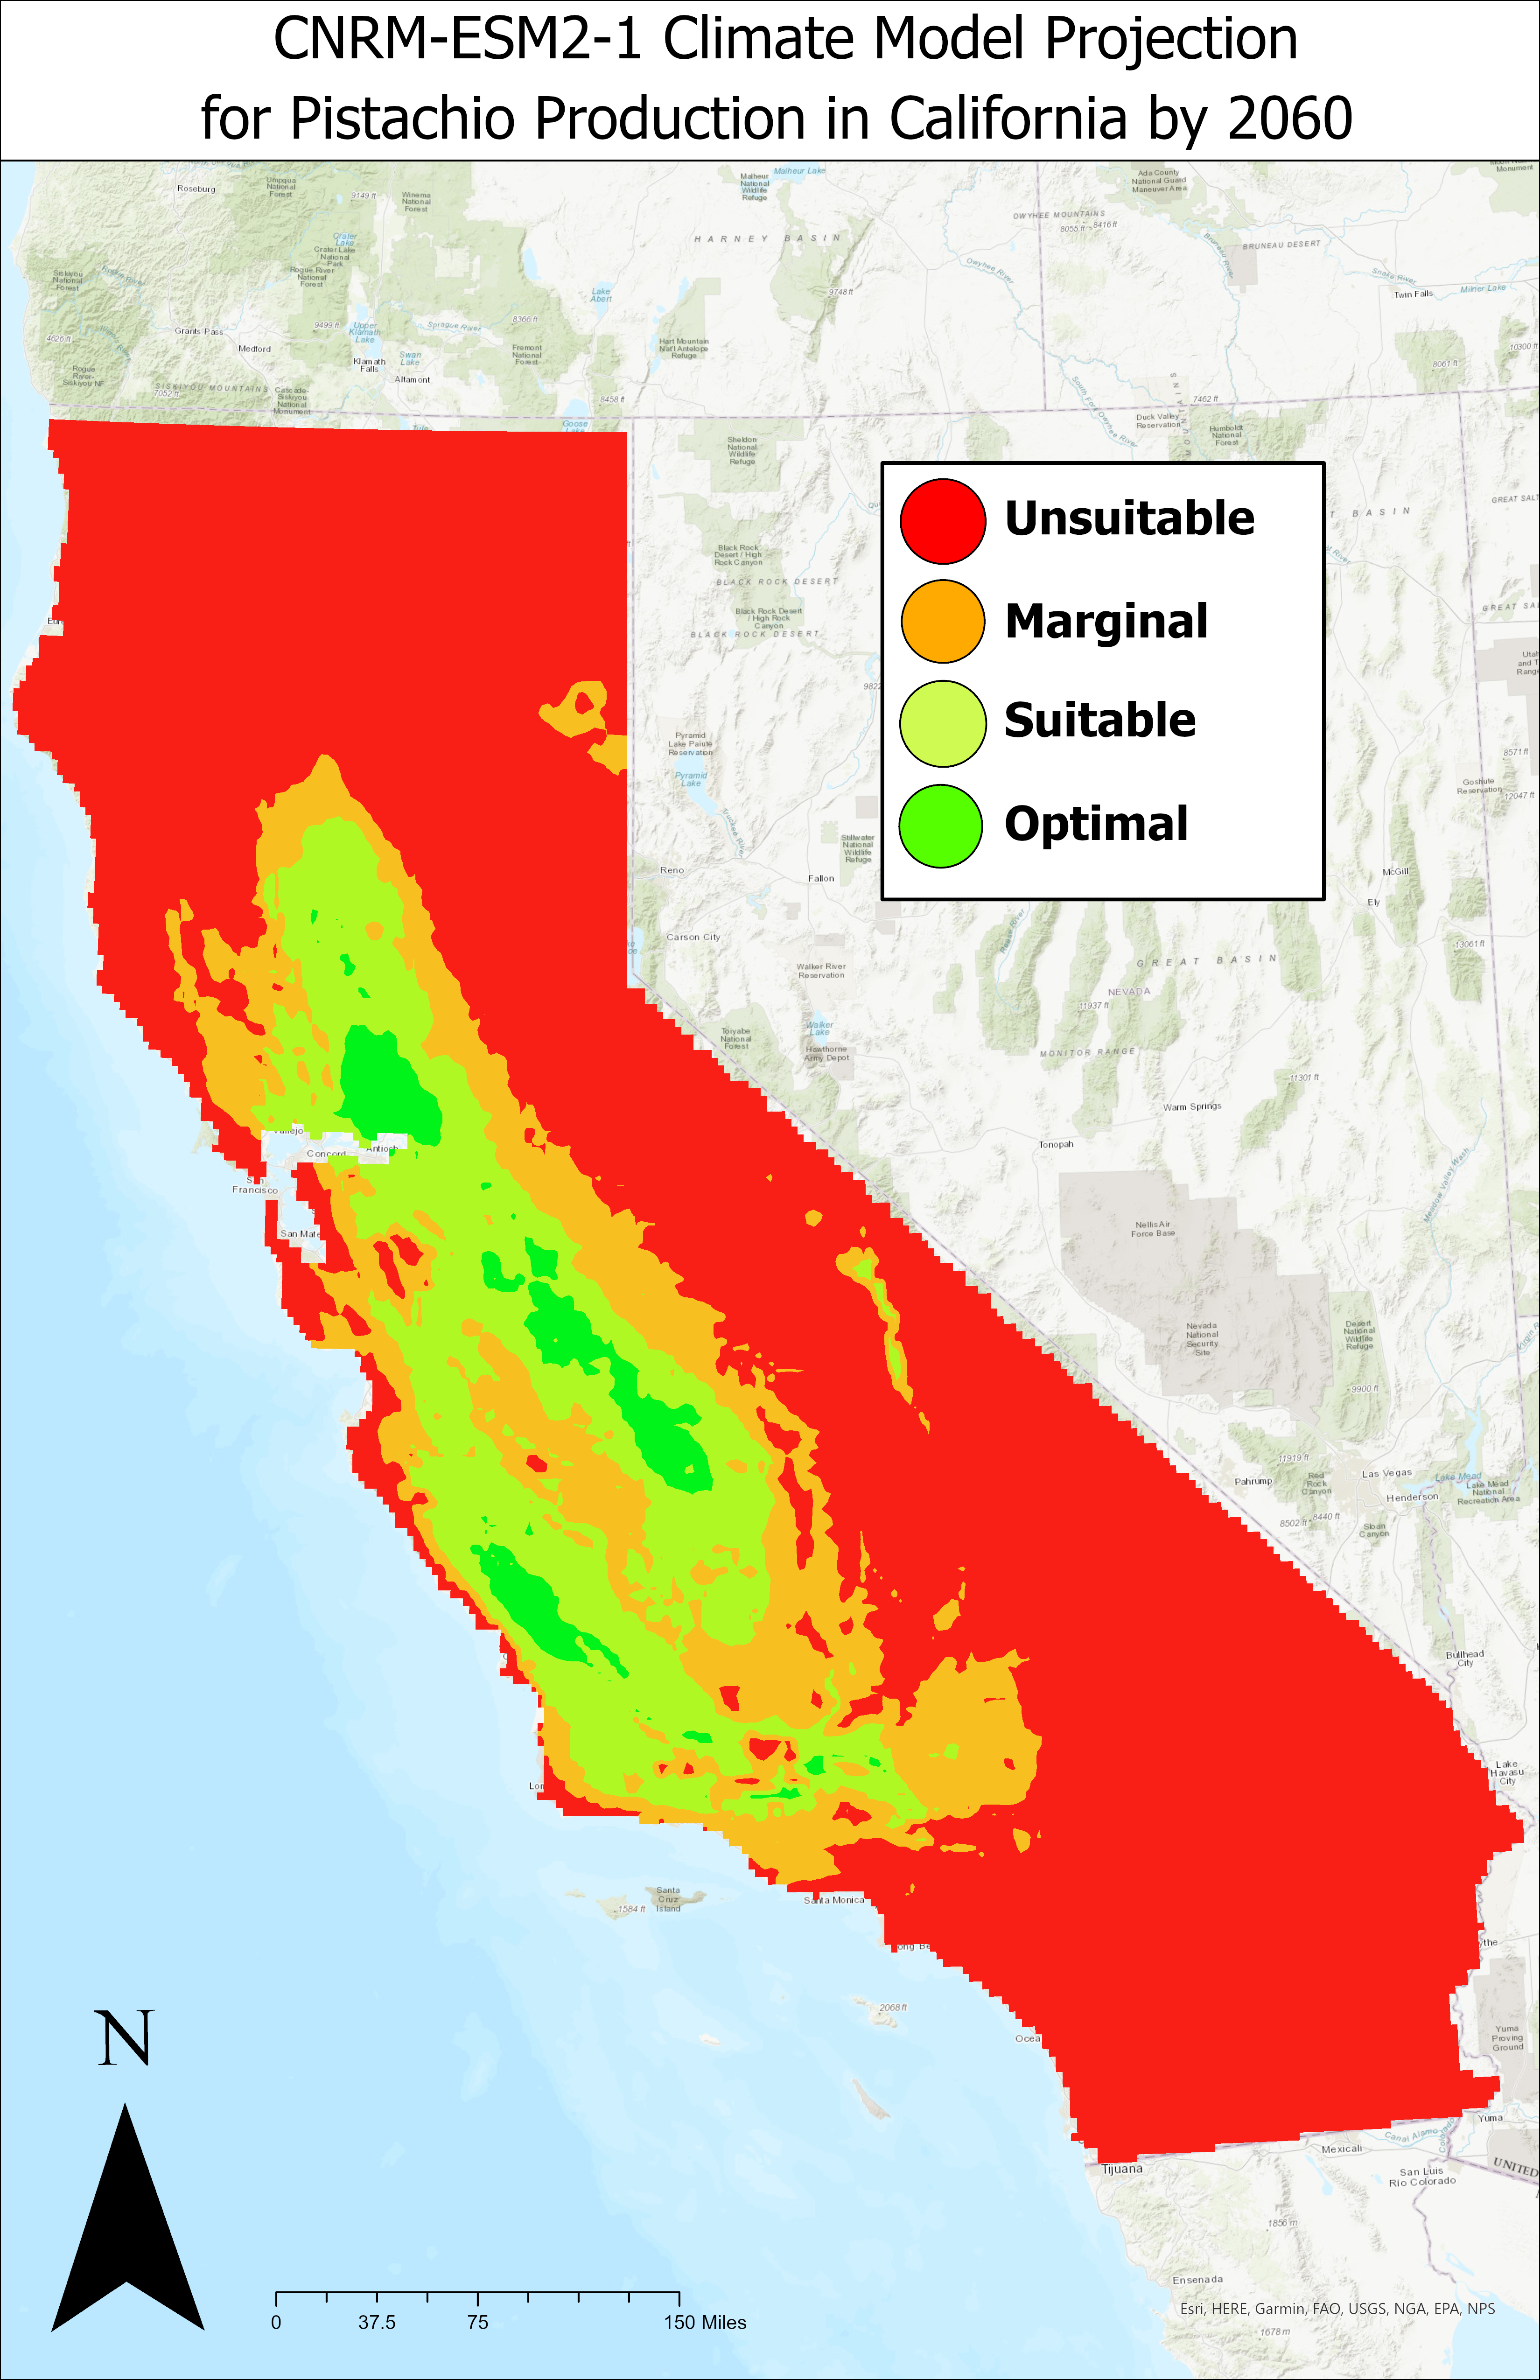
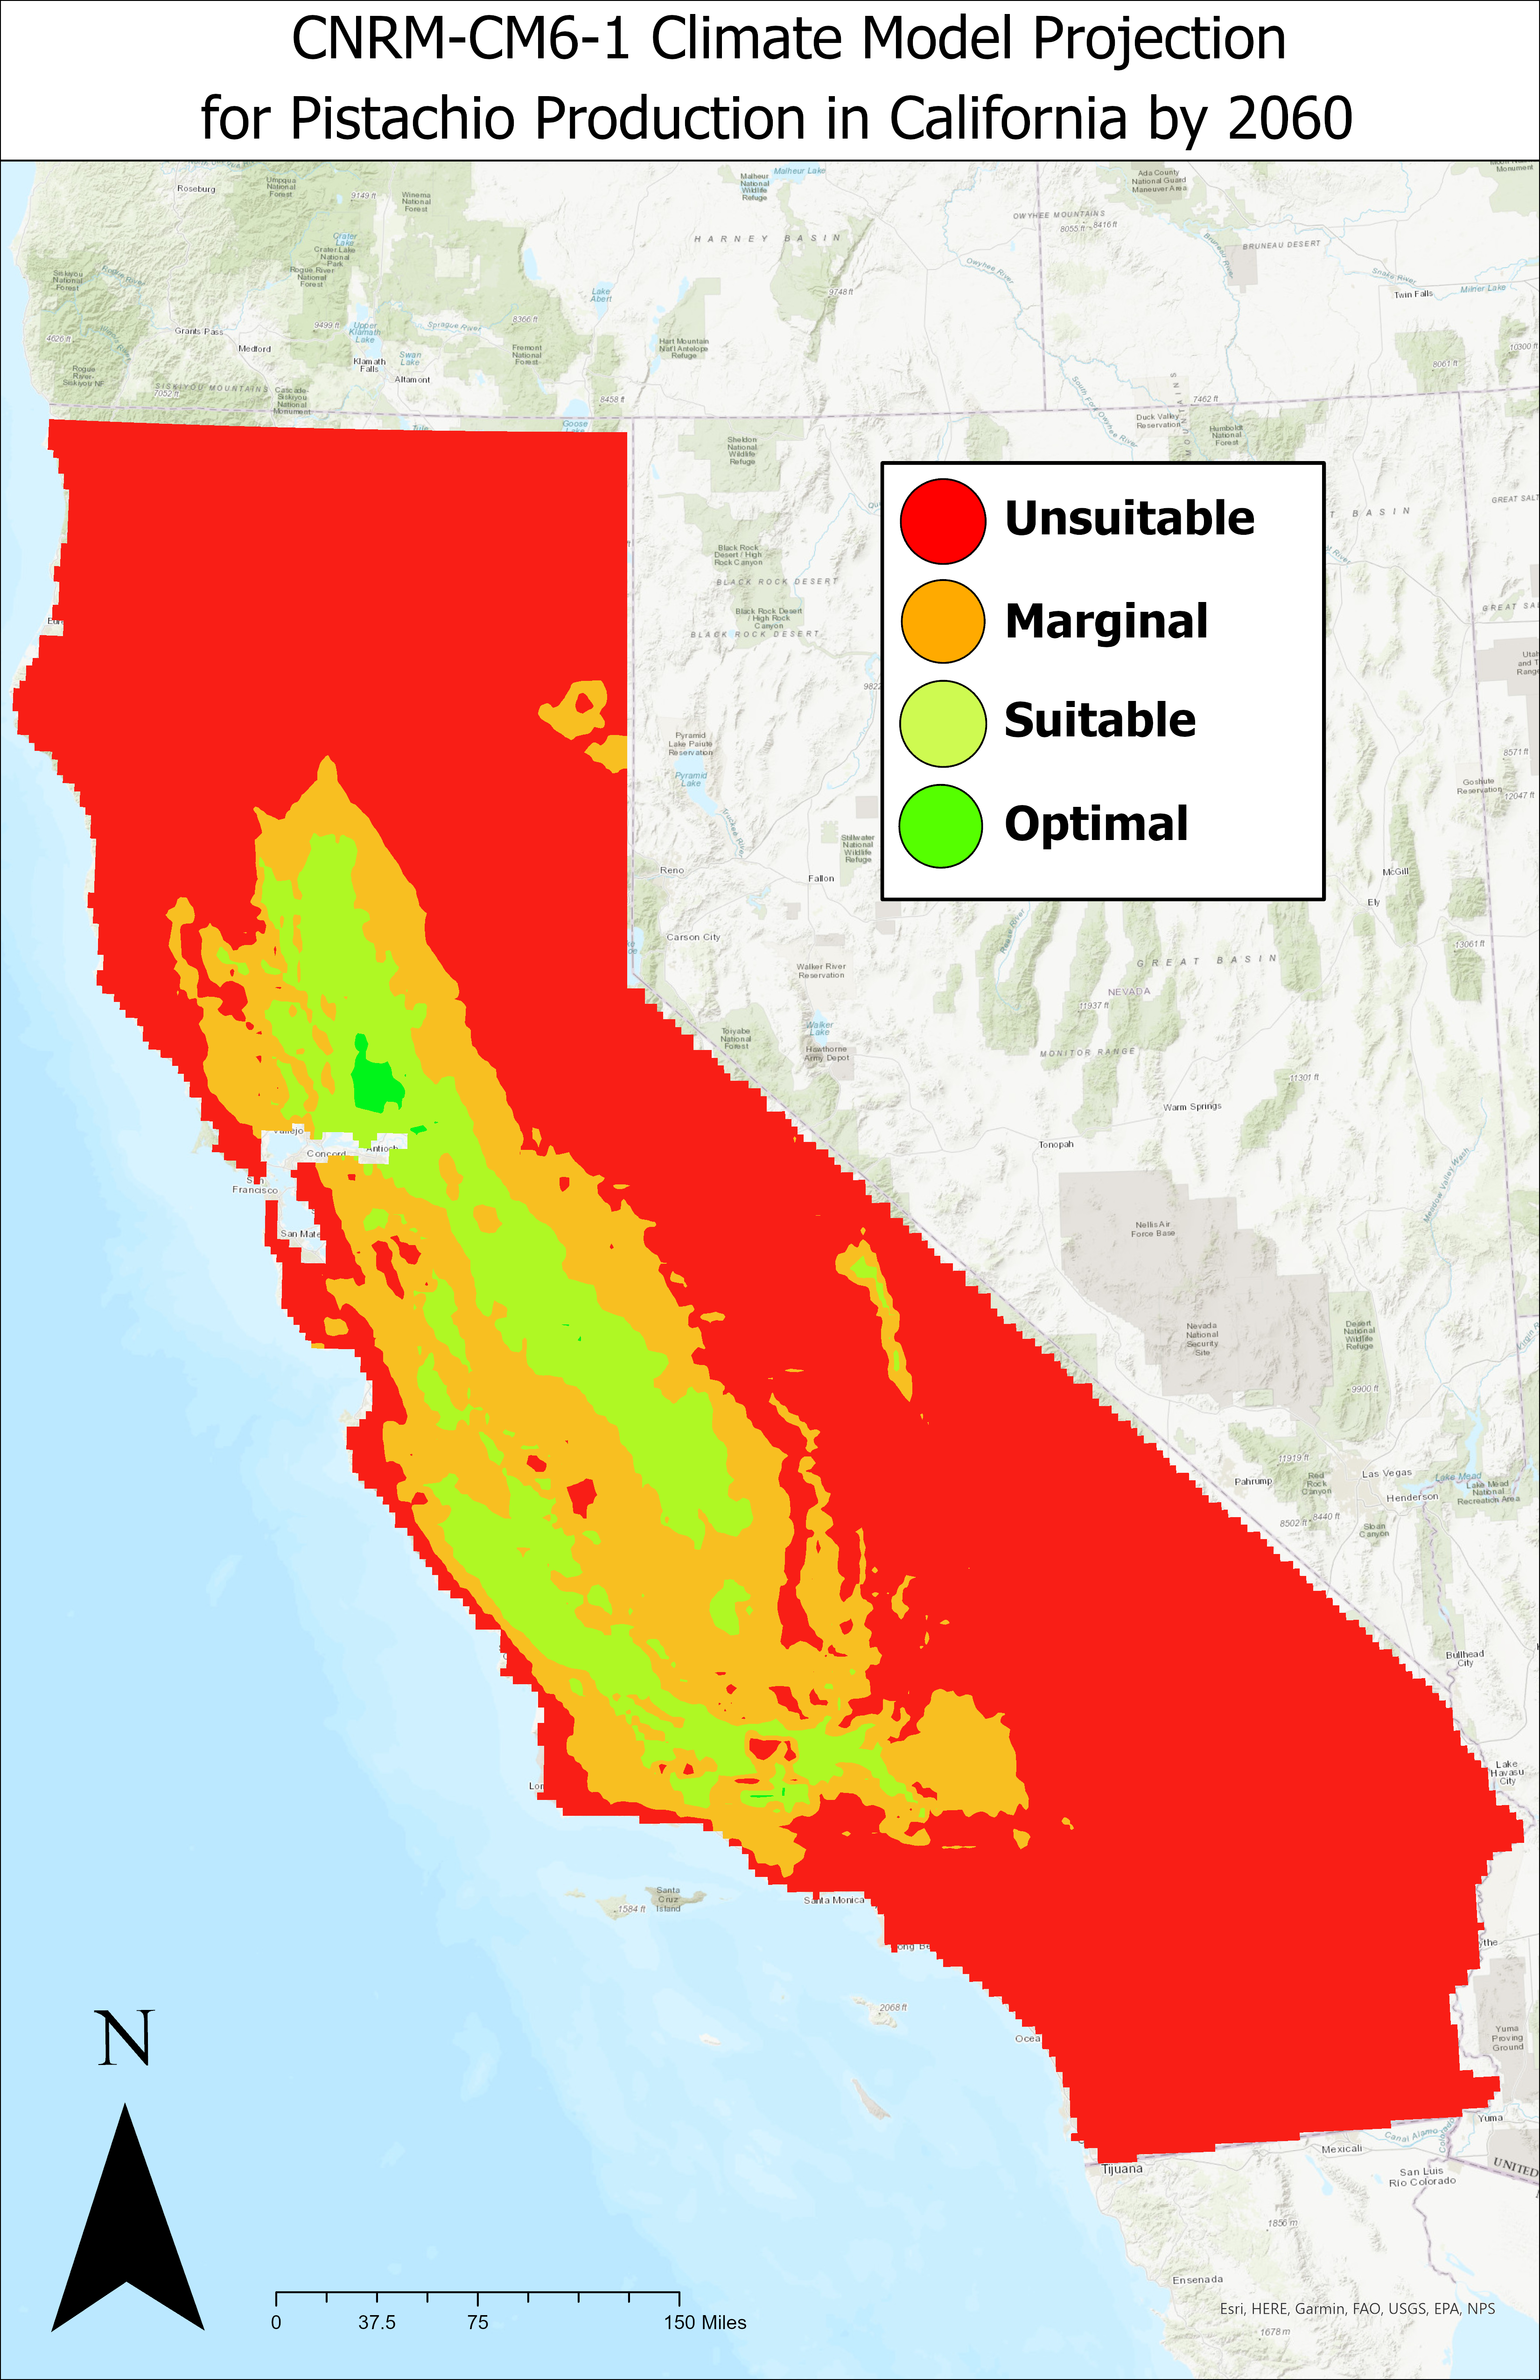
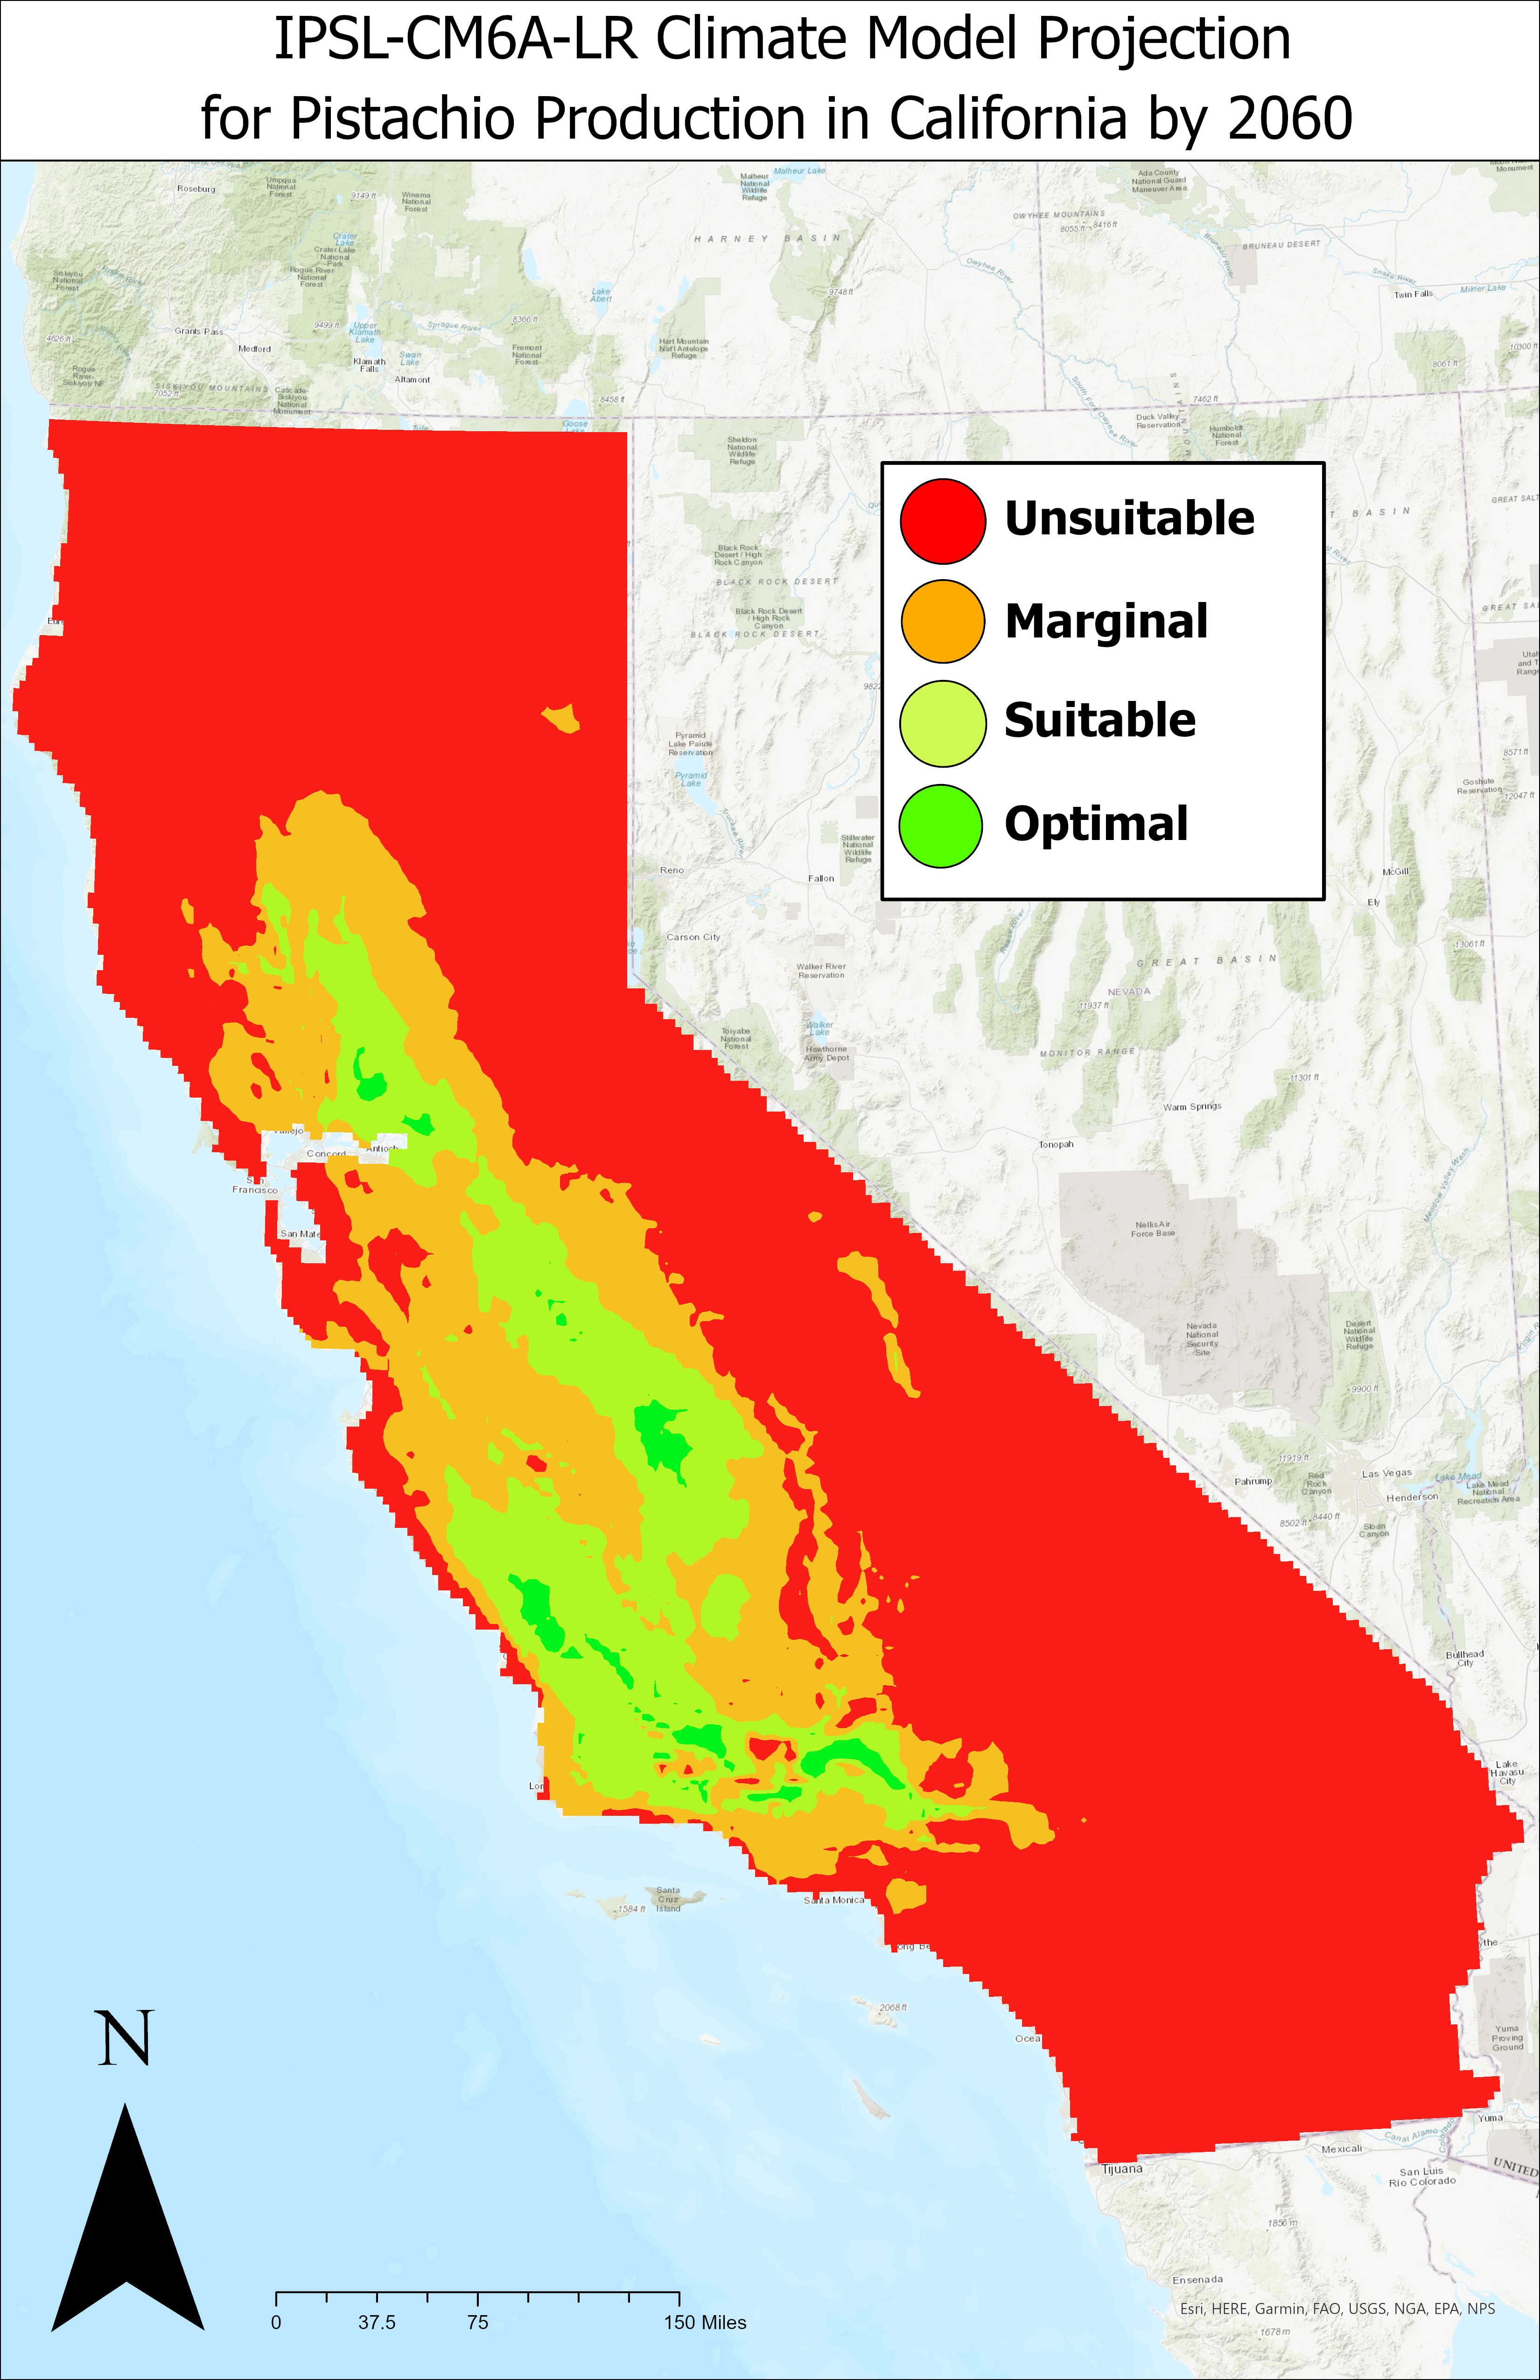
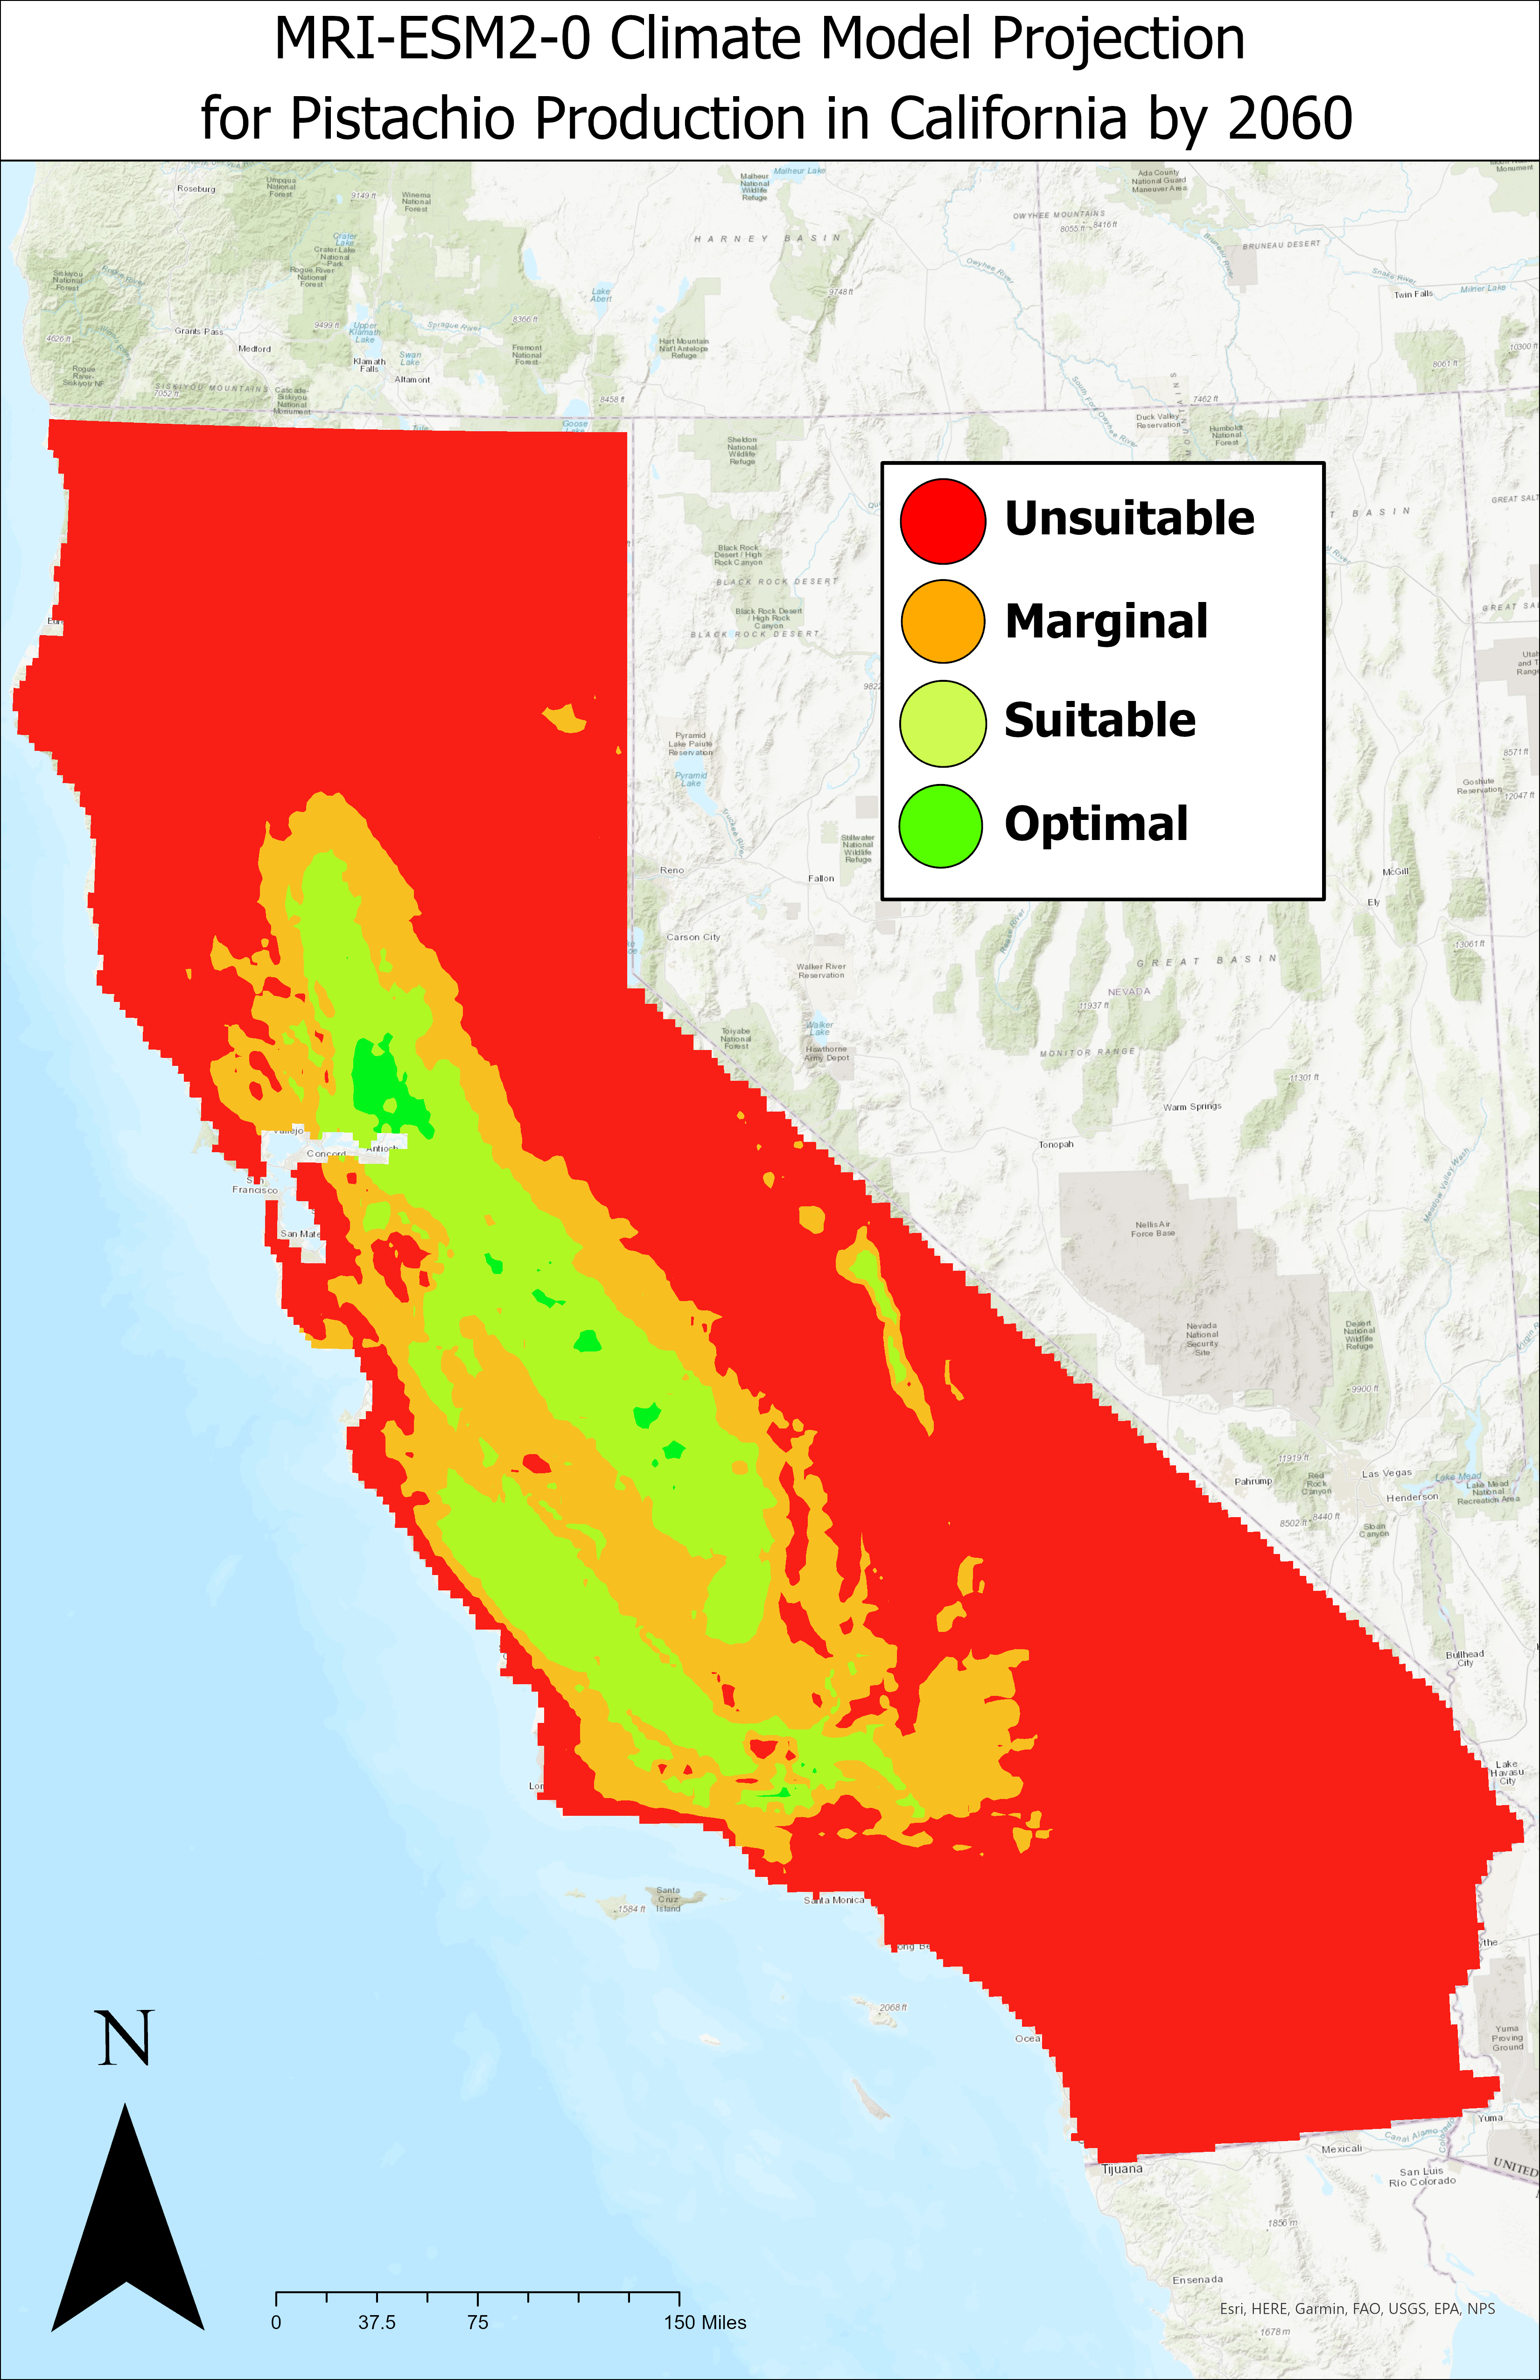
Figure 5. Individual outputs from each climate model by 2060.
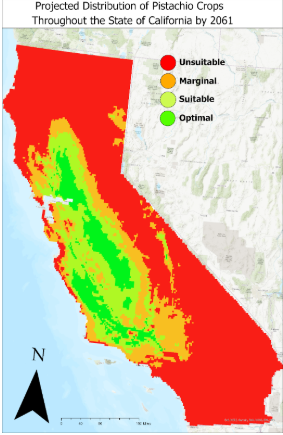
Figure 6. Displays the distribution of pistachio crops in California by the year 2061. When we compare this map to our baseline reference (Figure 4), we can see that there is very little expansion expected in the near future. We are able to identify that most regions are expected to experience a contraction in suitability, especially throughout the central valley and Southern California.
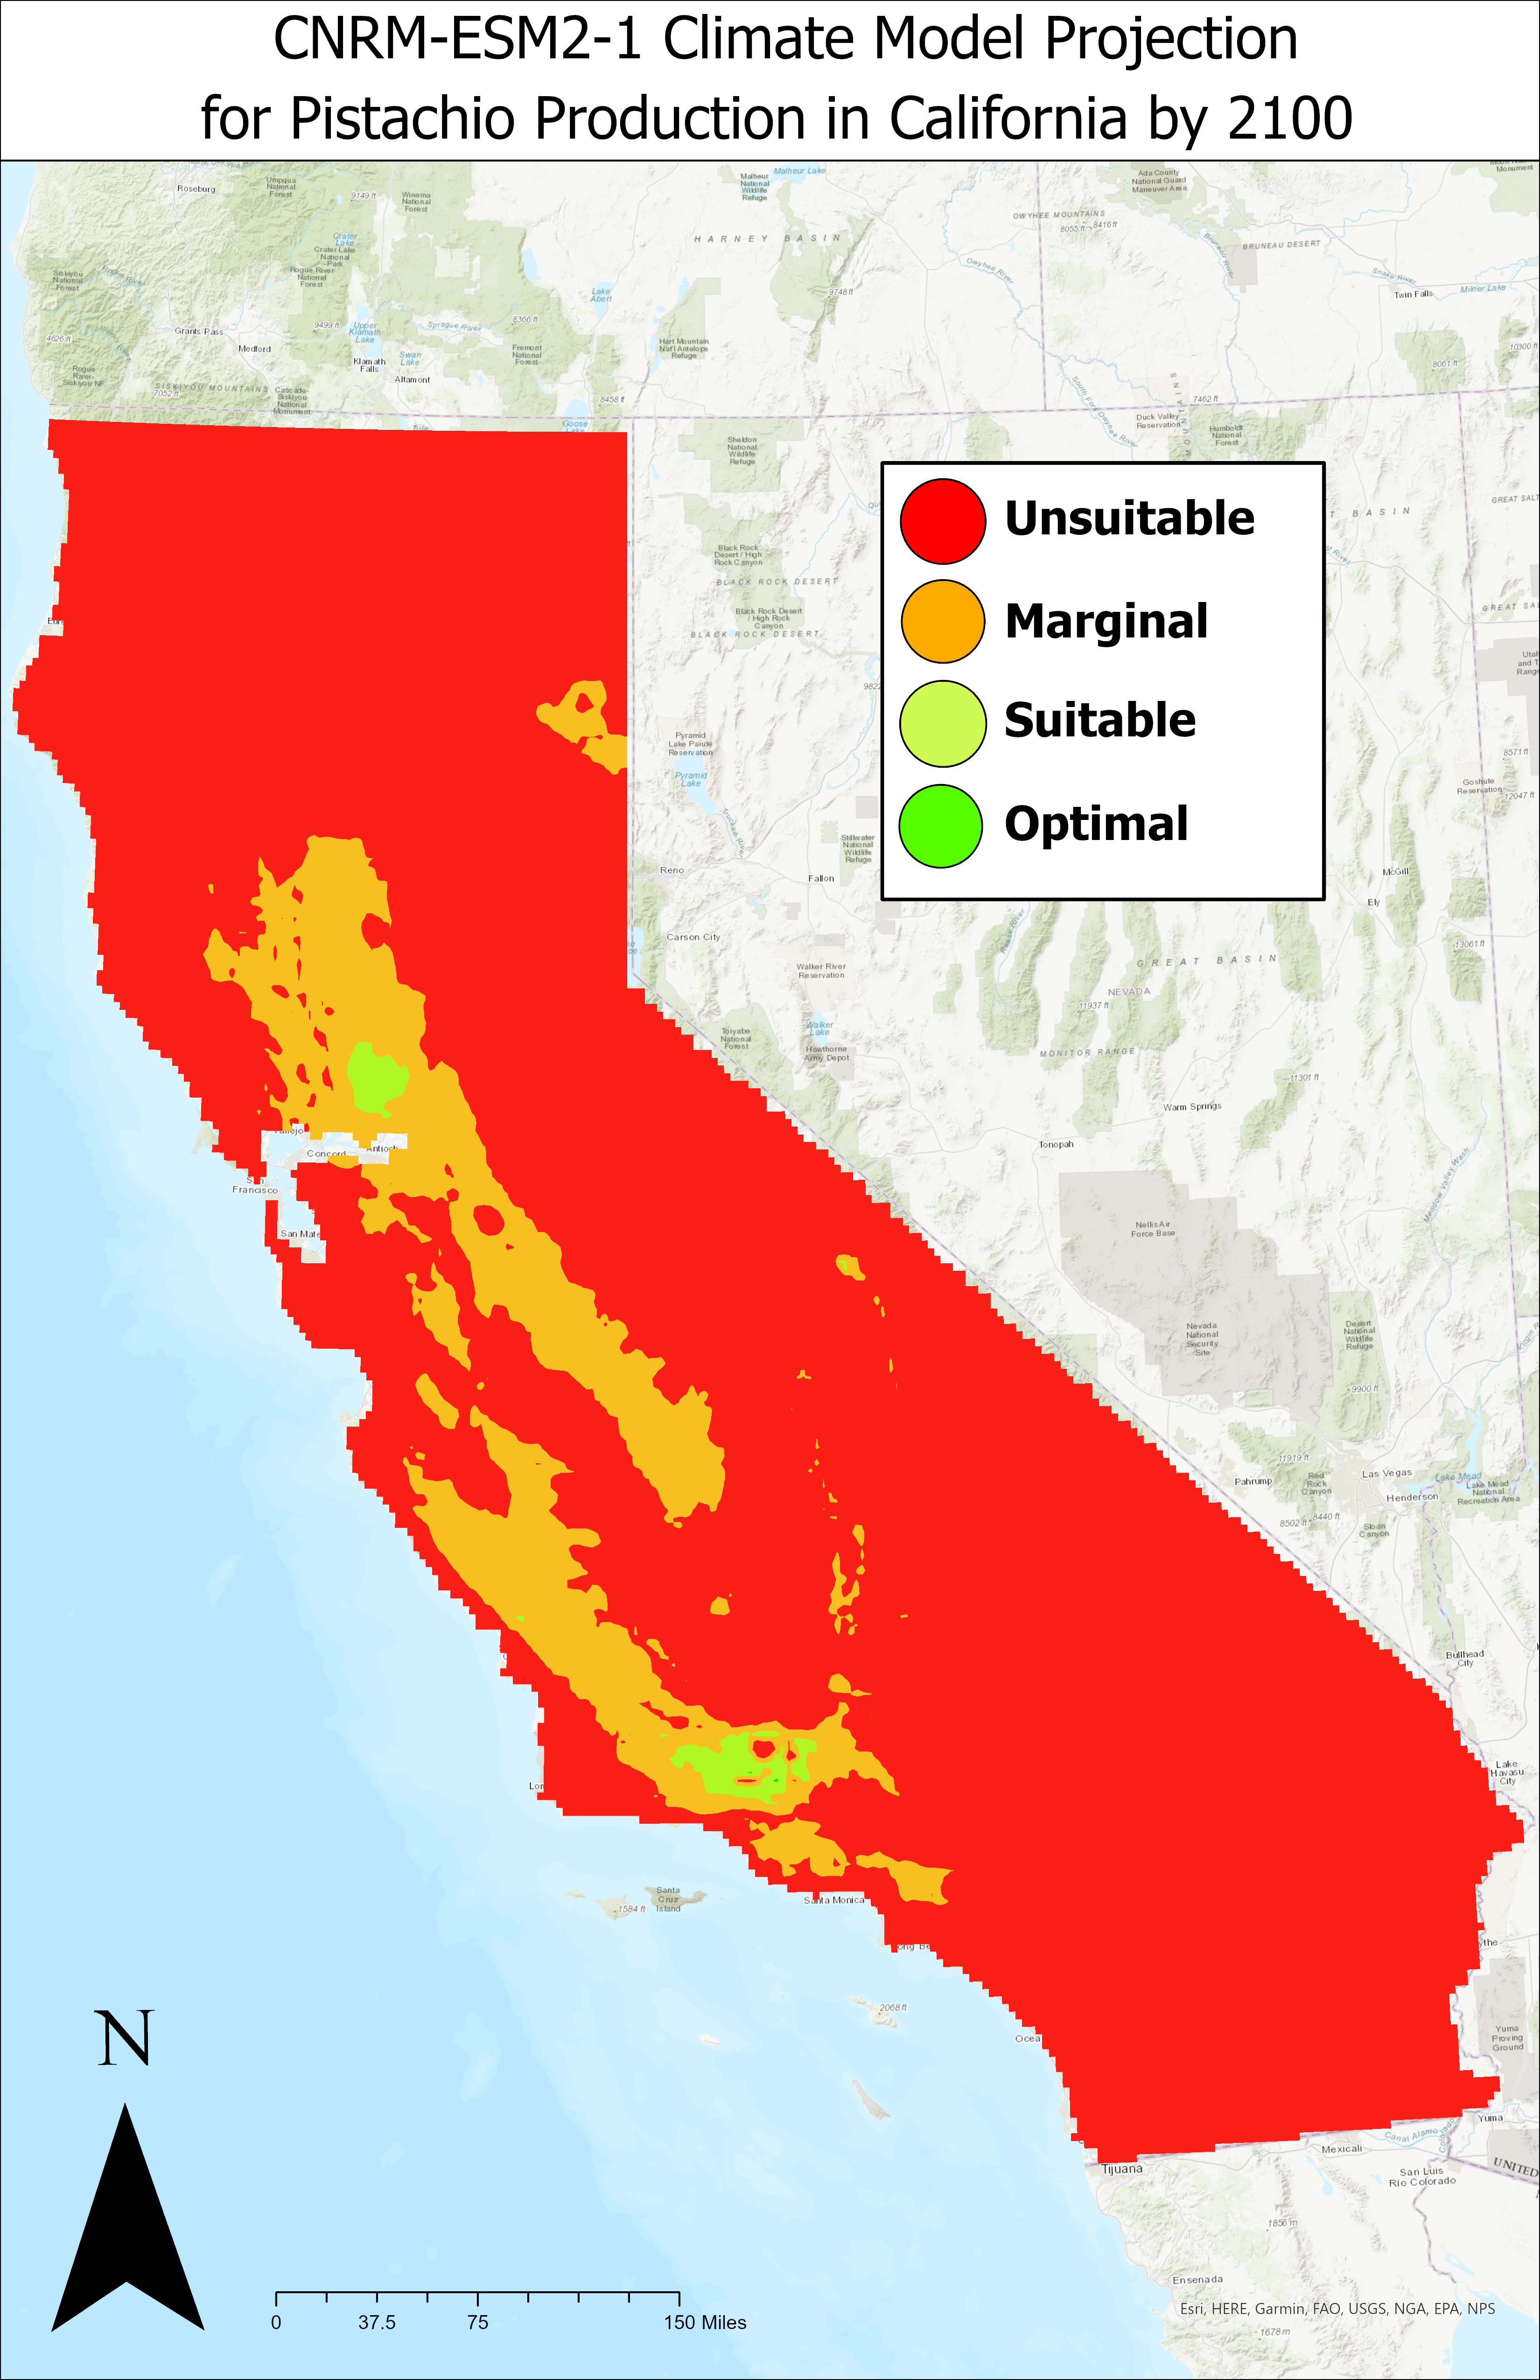
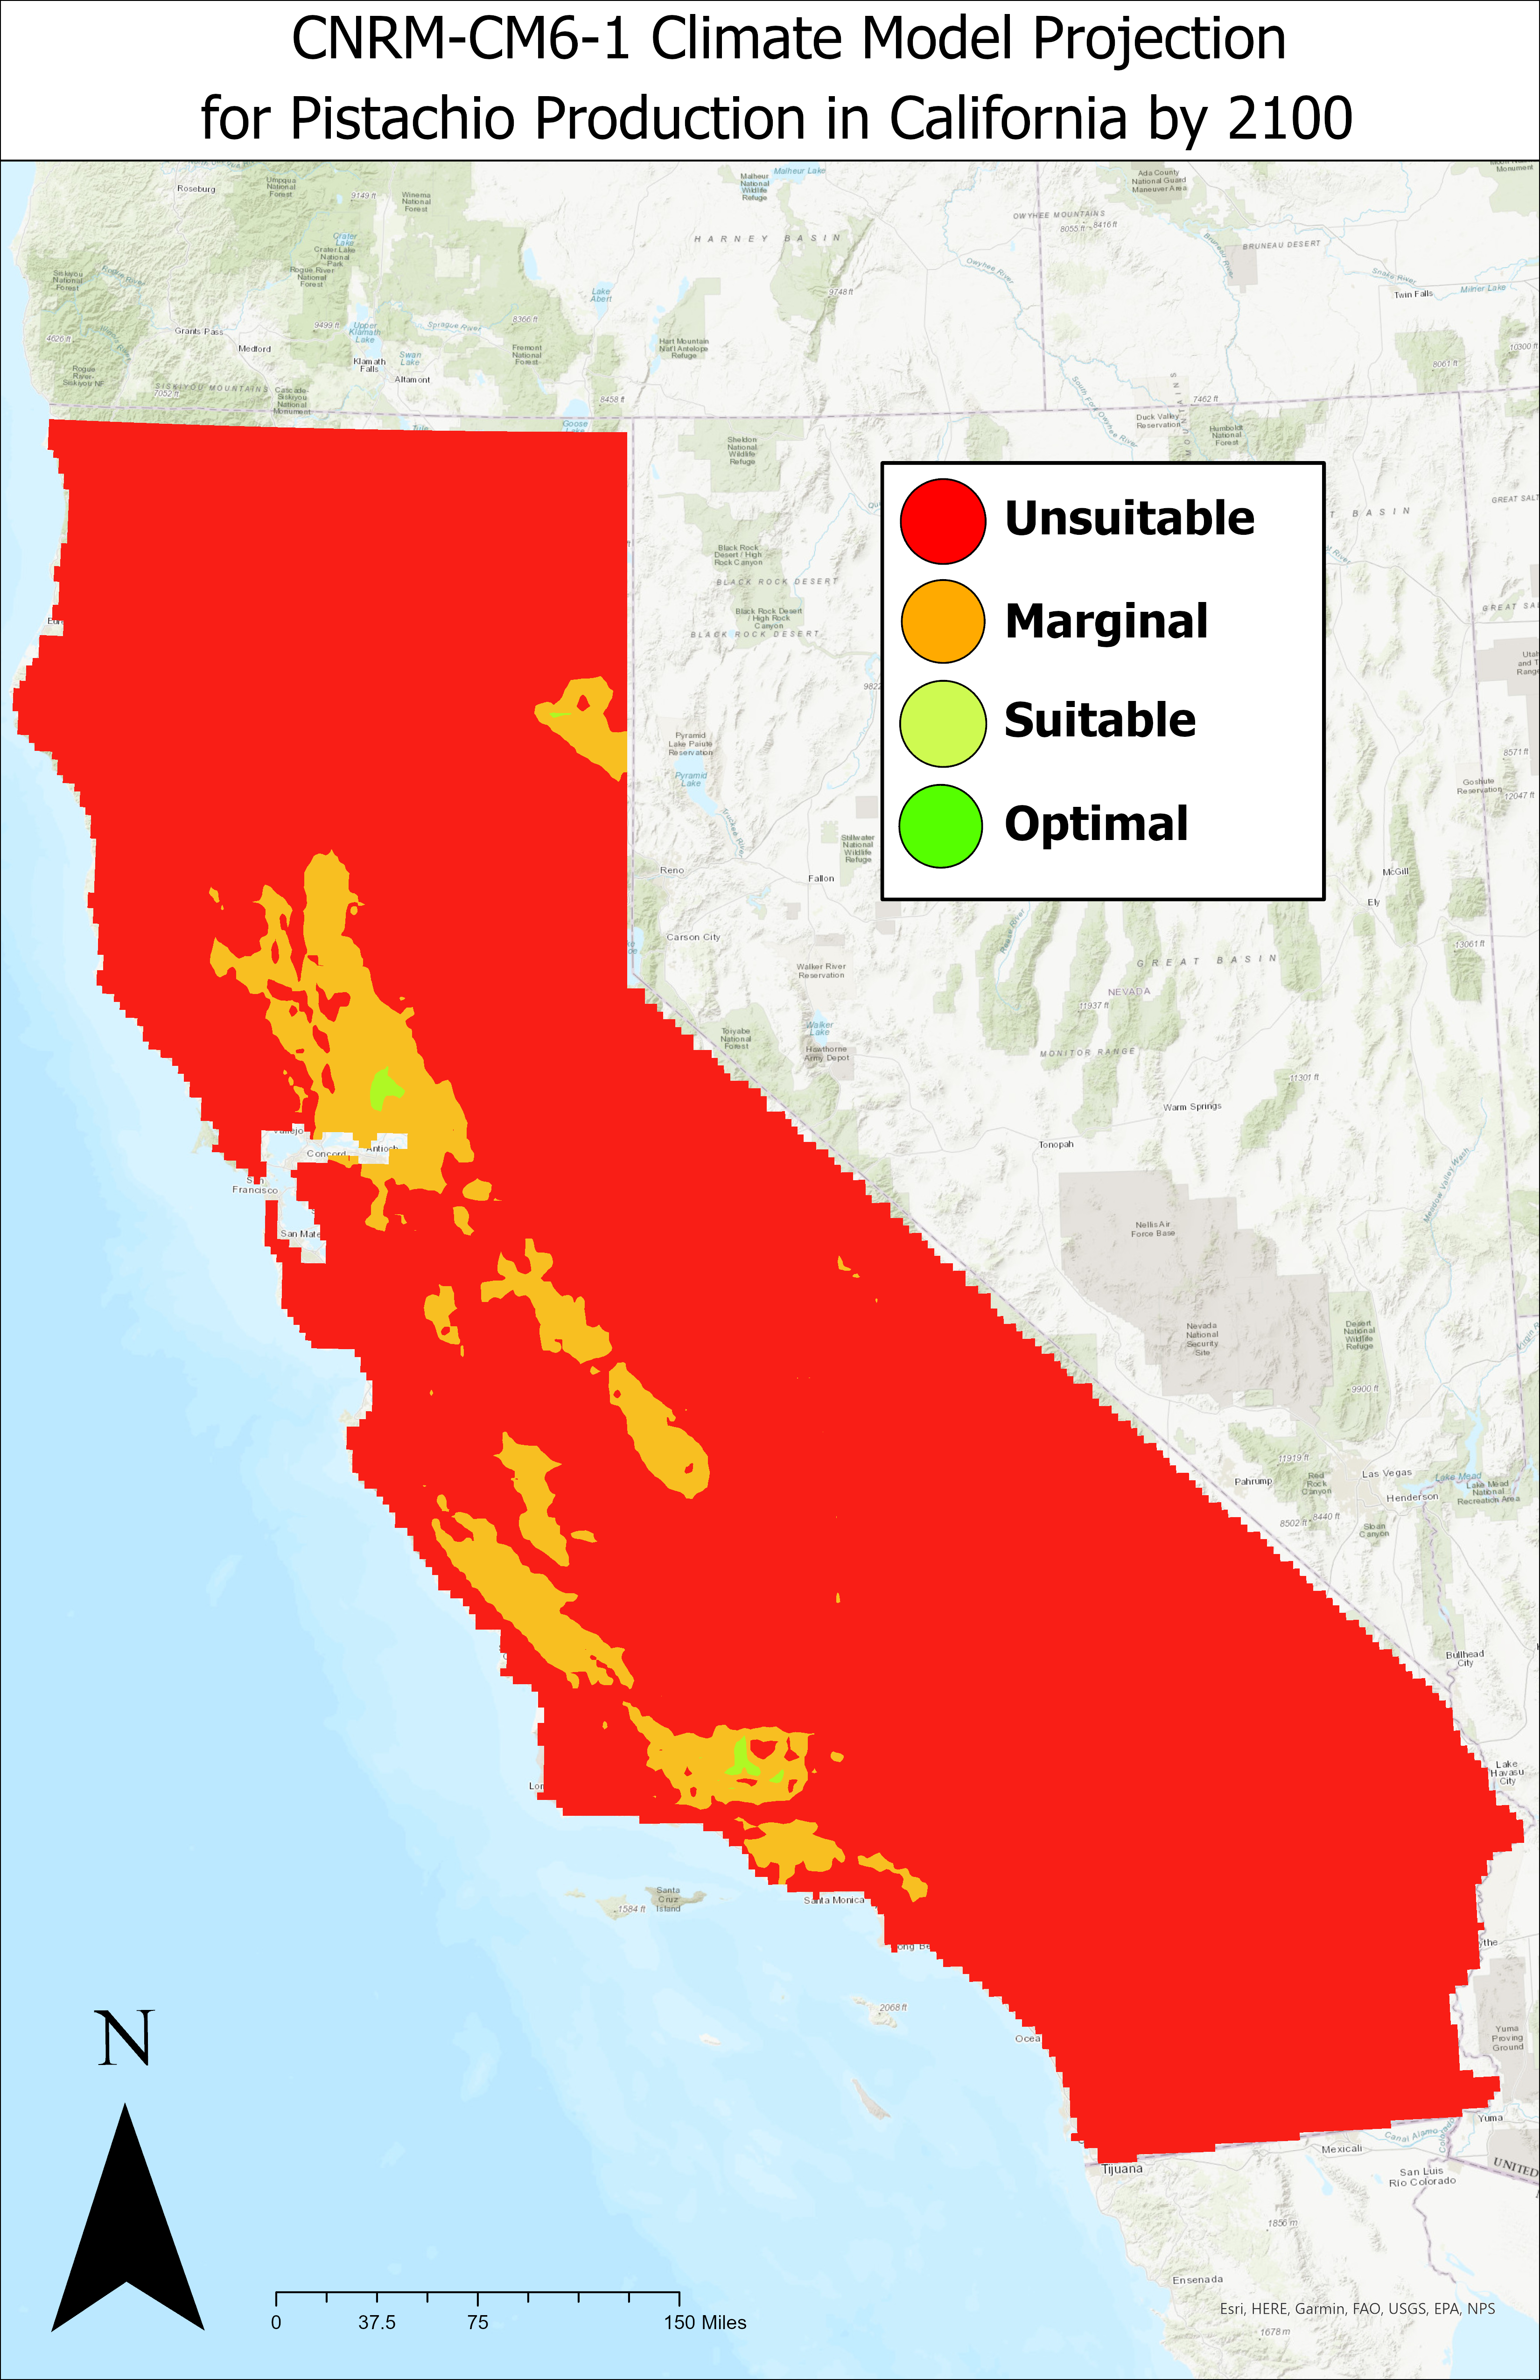
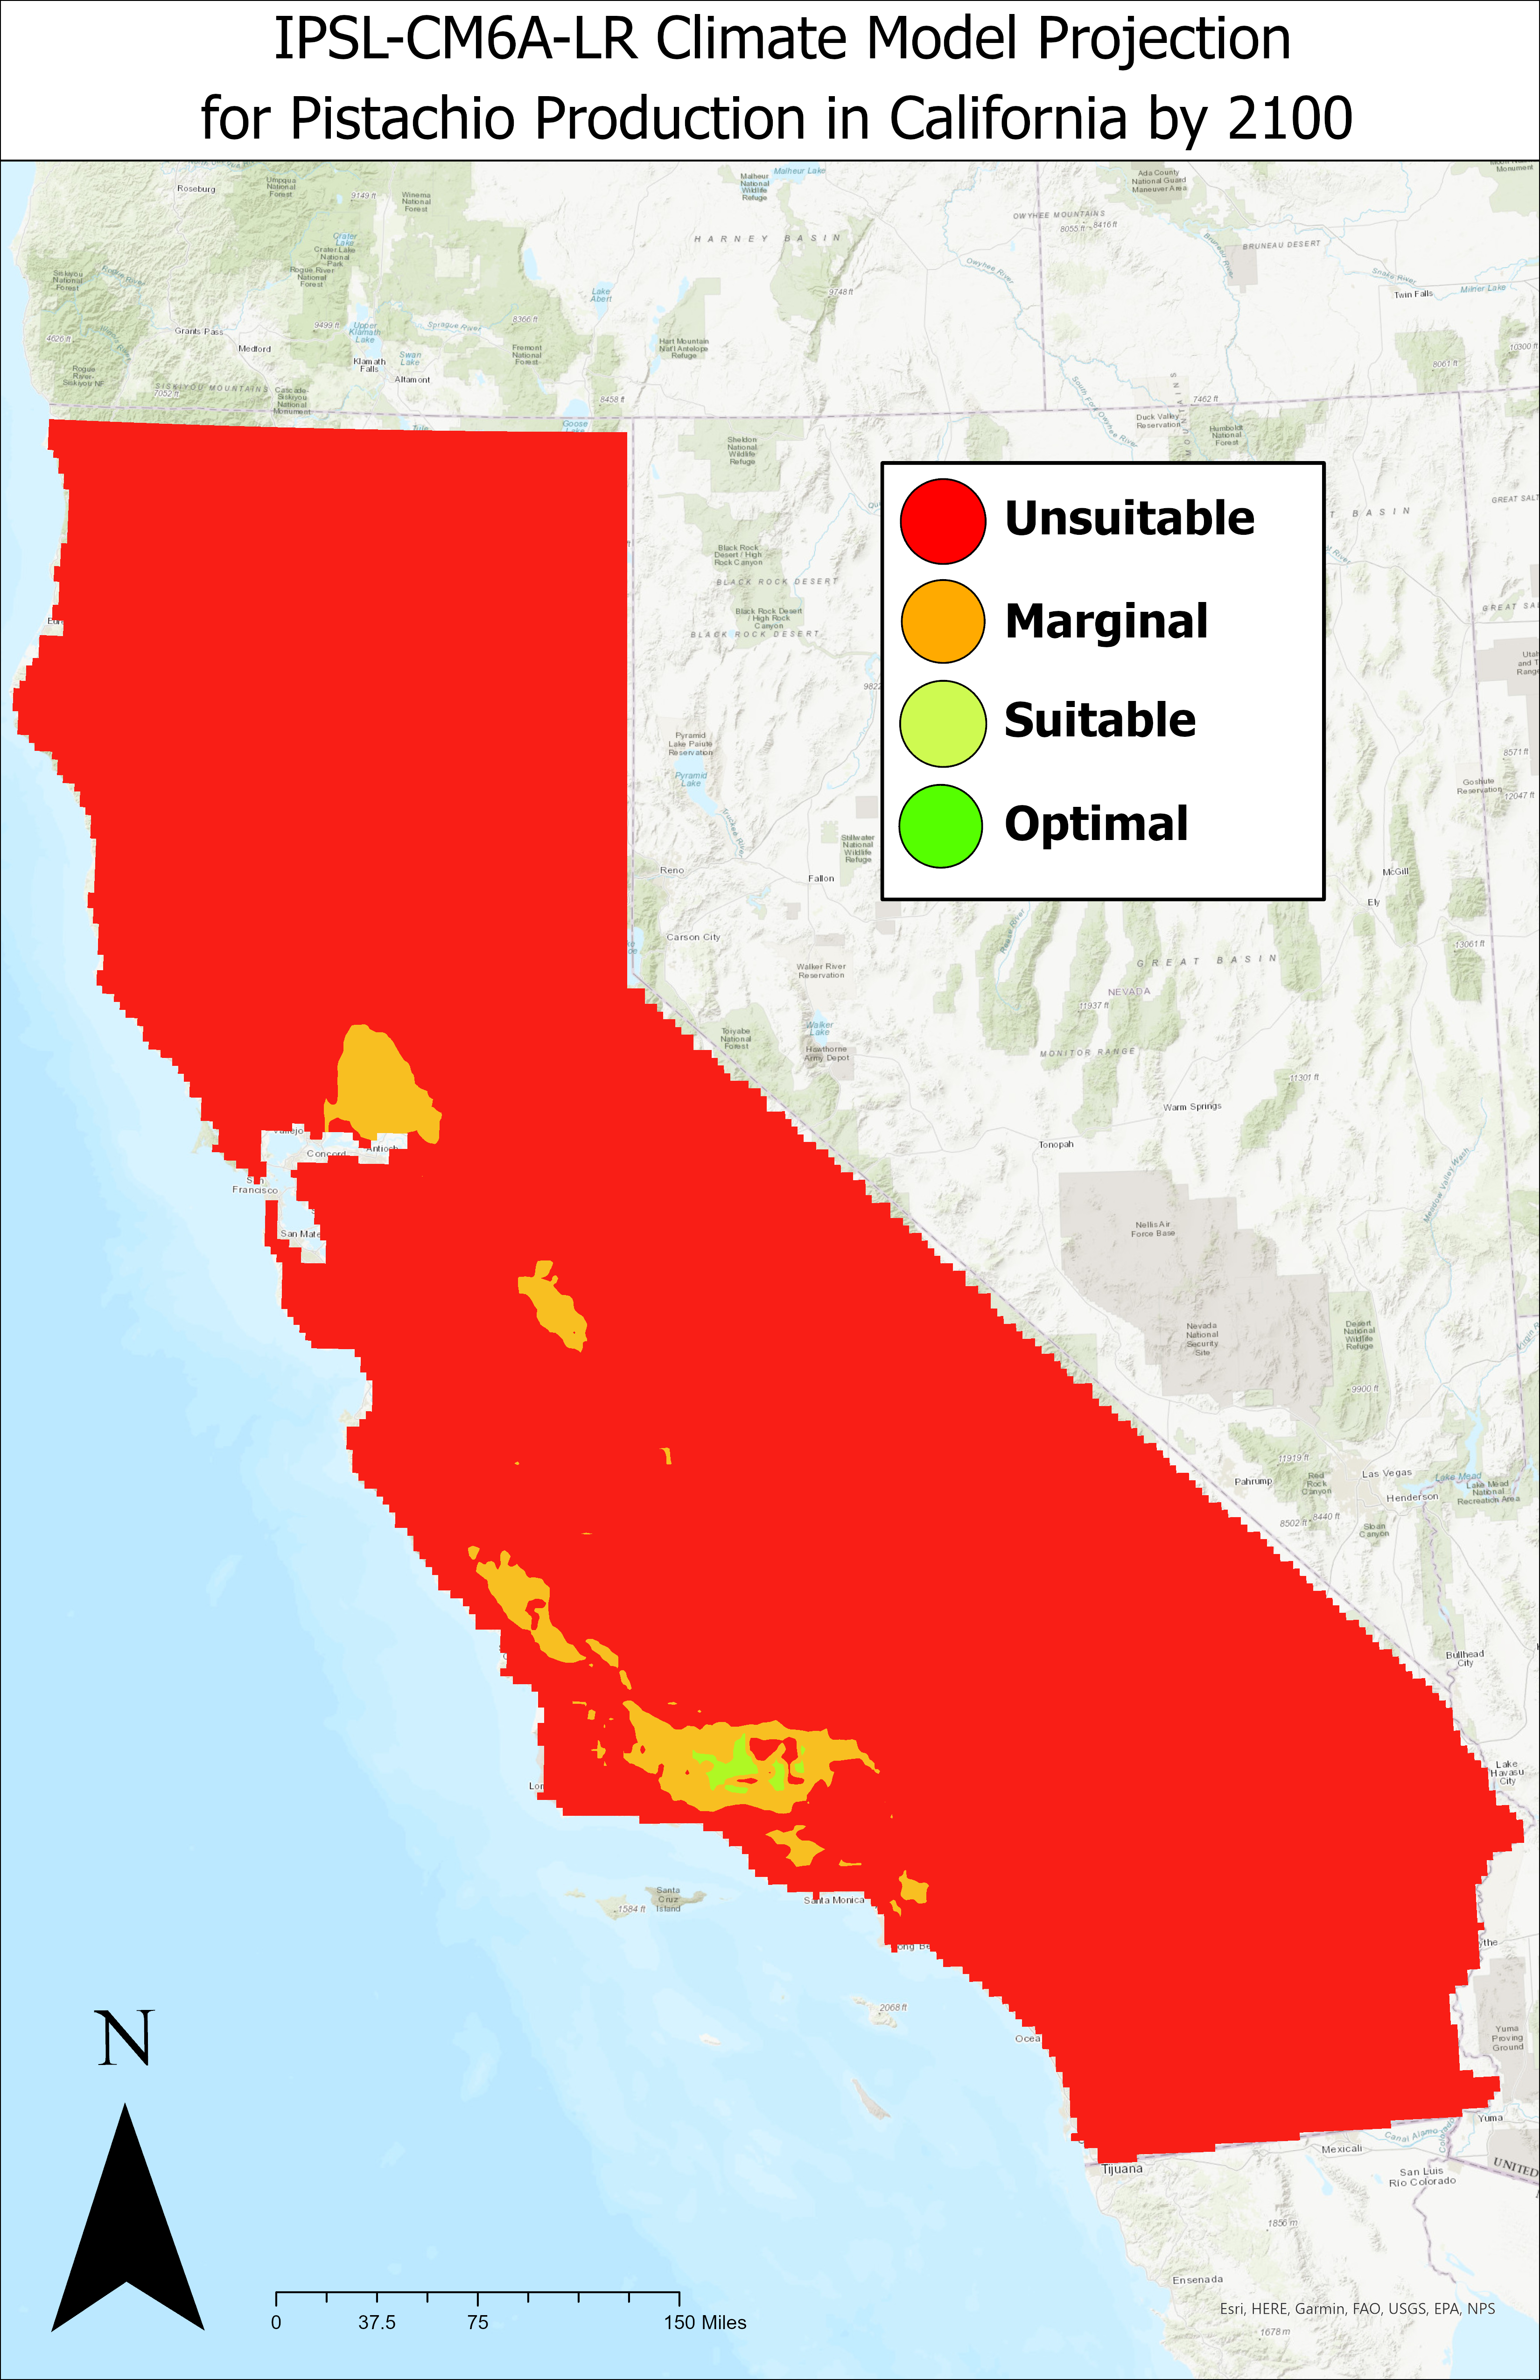
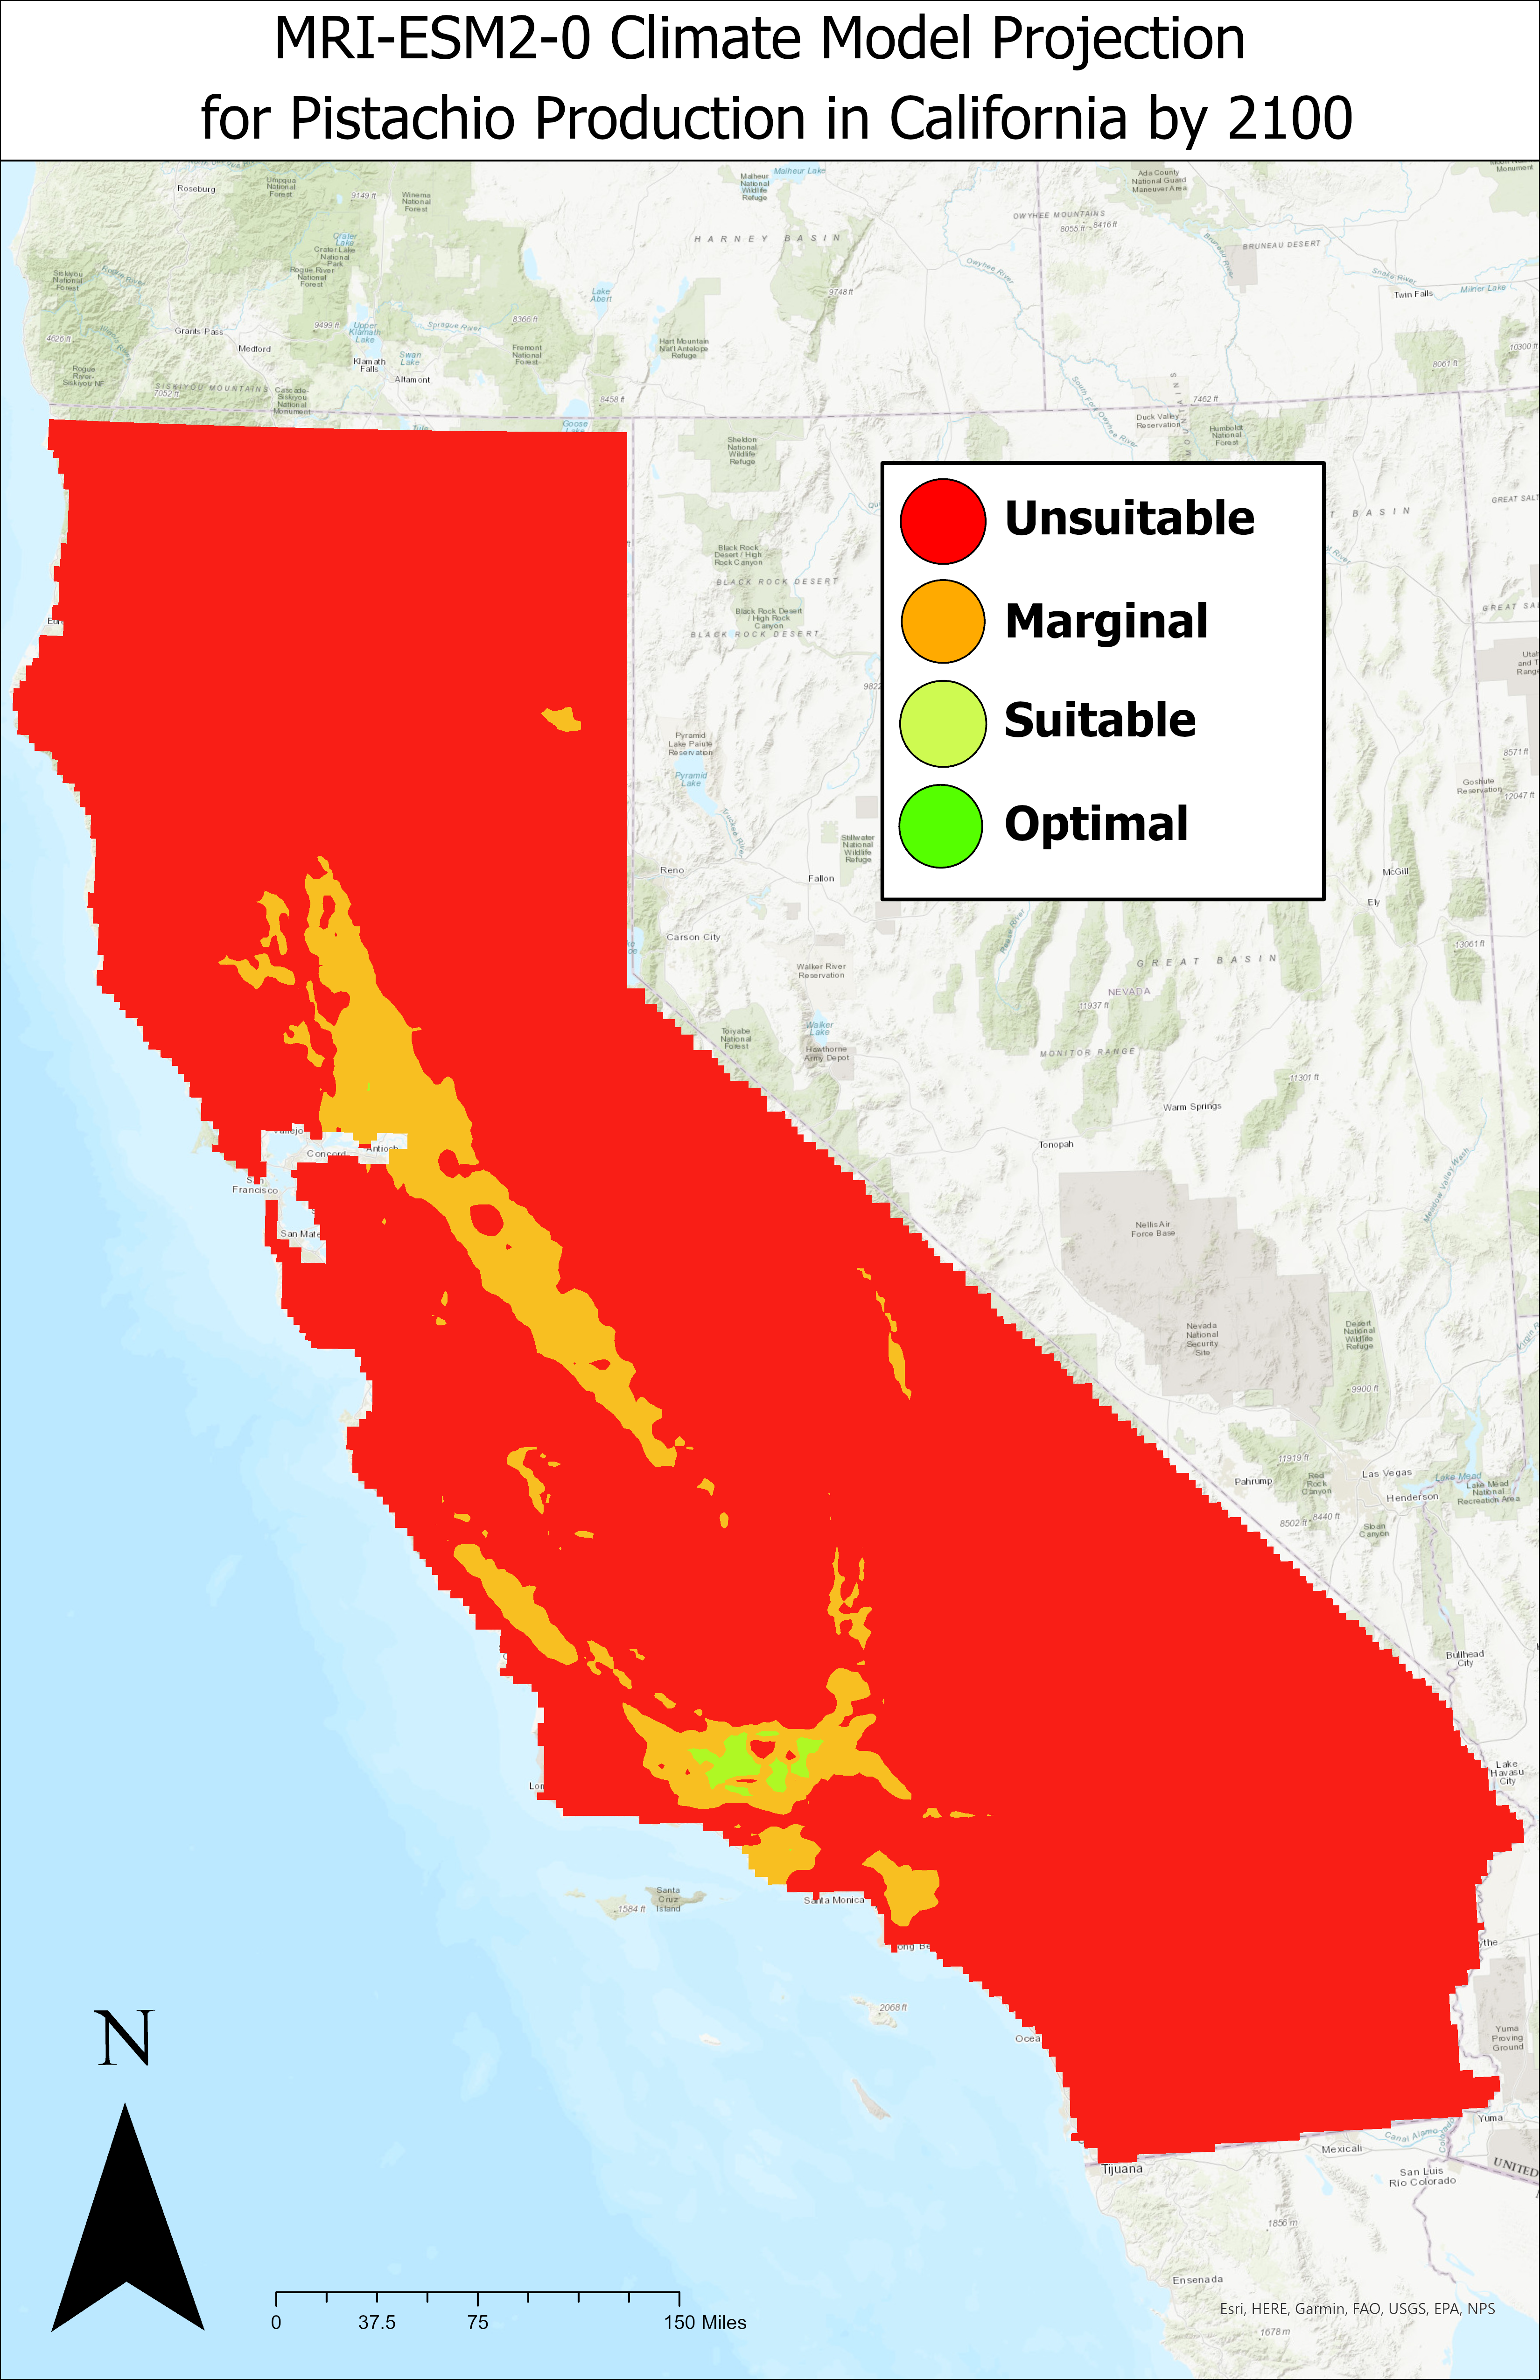
Figure 7. Individual outputs from each climate model by 2100.
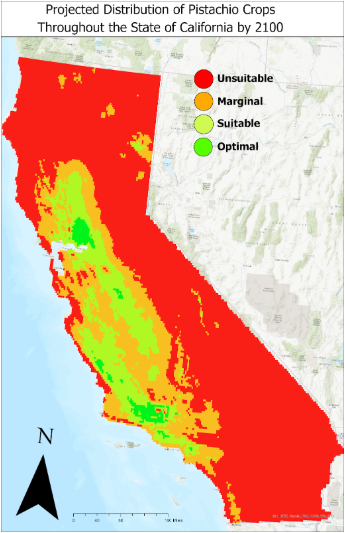
Figure 8. Displays the distribution of pistachio crops in California by the year 2100. When we compare these predictions to the baseline reference (Figure 4) or the previous prediction model (Figure 6), we can see that California will experience massive contraction throughout the state. Although we do see the revitalization of southern California’s pistachios toward the end of the 21st century.
4. Discussion
4.1 SDM Toolbox
At the beginning of this project, we were instructed to use the SDM toolbox, which was a downloadable extension for ArcGIS Pro and ArcMap. SDM stands for species distribution model and the toolbox contains a variety of tools, including a Max Ent tool that we wanted to use to perform our predictions. Unfortunately, the software for this extension hasn’t been updated and some tools are no longer compatible with the current versions of Arc Pro and ArcMap, including their max ent tool. Luckily, we are still able to utilze the rarify species occurrence data tool to reduce the spatial autocorrelation of the presence point data.
4.2 Transition to python
Since we were unable to use the max ent tool provided by the SDM toolbox, our group decided to search for alternative methods for running our predictions. For my contribution, I chose to create a python script using Presence Only Prediction (Max Ent) tool that is provided within ArcGIS Pro. The script took roughly two months to create and troubleshoot. After creating a working script we were able to obtain results that were similar to previous studies conducted by previous researchers.
We ran into a few problems when setting up the presence only prediction tool because we wanted to incorporate different climatic variables in the “features to predict” parameter. Whenever climate data was input into this parameter we would get an “RuntimeError: Object: Error” so we were unsuccessful in utilizing this feature. However, we were successful in utilizing the “explanatory rasters matching” parameter which we were able to use to input future climate models. We ran the tool, incorporating one future GCM at a time in the “explanatory rasters matching” parameter, in order to obtain a total of eight different projection outputs.
4.3 Projected Movement
We expect to see pistachios moving away from the coast; the current distribution displays pistachios crops along the coastal regions but we expect to see these areas lose their sustainability in the near future. We also see a lot of the central valley losing the vast majority of their optimal farmland by 2100. Overall, we can see that pistachios are expected to have a severe decline in productivity throughout the state. The only region that is actually expected to experience growth is in small areas of Northern California. These regions are at a much higher elevation than the regions pistachios have traditionally been grown; this is most likely due to this region having cooler average temperatures that have risen to a marginally suitable temperature range as a result of the changing climate.
5. Conclusions and Future Work
5.1 Conclusion
The main goal of this study is to provide insight into pistachio sustainability in order to inform farmers, policy makers, and landowners with the necessary information to make viable decisions about the cultivation of pistachios in response to the changing climate. It is clear that there is going to be a significantly different distribution of pistachio crops in the future. Adhering to the projections provided by this study would reduce the possibility of failed crops in the future.
5.2 Future Work
It is also important to note that the United State Department of Agriculture should be prepared to find suitable locations for growing pistachio crops outside of California. The state will take an economic hit with the loss of productivity but the consumer needs will still need to be fulfilled. I believe it would be important to look at pistachio sustainability throughout the Contiguous United States. This would provide valuable information for where pistachios should be moved to replace the deficiency introduced to the market.
In an attempt to provide this information to the public, I have currently built a climate model database for the Contiguous United States in order to test for pistachio suitability zones. I have used the same timeframe, SSP, and resolution as this study utilizes for each climate model. I have also rarified pistachio presence points from Arizona, New Mexico, and Texas which account for the remaining 2% of pistachios grown in the United States. The python script for the new presence only prediction is still undergoing troubleshooting but the data has been acquired and it ready for processing.
Author Contributions
I, Dylan Russell, am the sole author of this research paper. The GIS analyses were performed by me over the course of a two year period. The research design was proposed by Dr. Gabriel Granco, who oversaw the research as a faculty advisor and provided the necessary datasets.
Additional Material
The python script used for this study can be found here. The bioclimatic data can be acquired through WorldClim.org and the crop distribution data can be acquired for the CDL provided by the USDA.
References
Brown, J. L. (2014, April 22). SDMtoolbox: A python‐based GIS toolkit for landscape genetic, ... British Ecological Society. https://besjournals.onlinelibrary.wiley.com/doi/full/10.1111/2041-210X.12200
Damaneh, Javad Momeni, et al. “Prediction of Wild Pistachio Ecological Niche Using Machine Learning Models.” Science Direct, Ecological Informatics, Dec. 2022, https://www-sciencedirect-com.proxy.library.cpp.edu/science/article/pii/S1574954122003570.
Derya, Aydin, et al. “Effect of High Temperature Events on Pistachio Growth and Development, Yield, and Quality.” International Journal of Plant Production, vol. 14, no. 2, 2020, pp. 169–180.
Fitzgibbon, Abigail, et al. “Evaluation of Maximum Entropy (Maxent) Machine Learning Model to Assess Relationships between Climate and Corn Suitability.” Land, vol. 11, no. 9, 2022, p. 1382., https://doi.org/10.3390/land11091382.
Gonzalez-Dugo, V., et al. “Improving the Precision of Irrigation in a Pistachio Farm Using an Unmanned Airborne Thermal System.” Irrigation Science, vol. 33, no. 1, 2014, pp. 43–52., https://doi.org/10.1007/s00271-014-0447-z.
Granco, Gabriel, et al. “Potential Effects of Climate Change on Brazil’s Land Use Policy for Renewable Energy from Sugarcane.” Resources, Conservation and Recycling, vol. 144, 2019, pp. 158–168., https://doi.org/10.1016/j.resconrec.2019.01.033.
Kerr, Amber, et al. “Vulnerability of California Specialty Crops to Projected Mid-Century Temperature Changes.” Climatic Change, vol. 148, no. 3, 2017, pp. 419–436., Sep 2017, https://doi.org/10.1007/s10584-017-2011-3.
Lu, B. “Water Use Efficiency and Growth of Pistachio (Pistacia Vera L.) under Deficit Irrigation and Waterlogging Stress.” Agricultural Water Management, vol. 218, 2019, pp. 33–43.
Ross, Karen. “CALIFORNIA AGRICULTURAL STATISTICS REVIEW 2019-2020.” California Department of Food and Agriculture, https://www.cdfa.ca.gov/Statistics/PDFs/2020_Ag_Stats_Review.pdf.
WorldClim. (n.d.). Retrieved April 23, 2023, from https://www.worldclim.org/data/cmip6/cmip6_clim30s.html
Yarahmadi, Jamshid, and Ata Amini. “Determining Land Suitability for Pistachio Cultivation Development Based on Climate Variables to Adapt to Drought.” Theoretical and Applied Climatology, vol. 143, no. 3-4, 2021, pp. 1631–1642., https://doi.org/10.1007/s00704-020-03499-4.
Zurell, Damaris, et al. “A Standard Protocol for Reporting Species Distribution Models.” Ecography, vol. 43, no. 9, 17 Jan. 2020, pp. 1261–1277., https://doi.org/10.1111/ecog.04960.